phase one
Usability Test & Think-Aloud
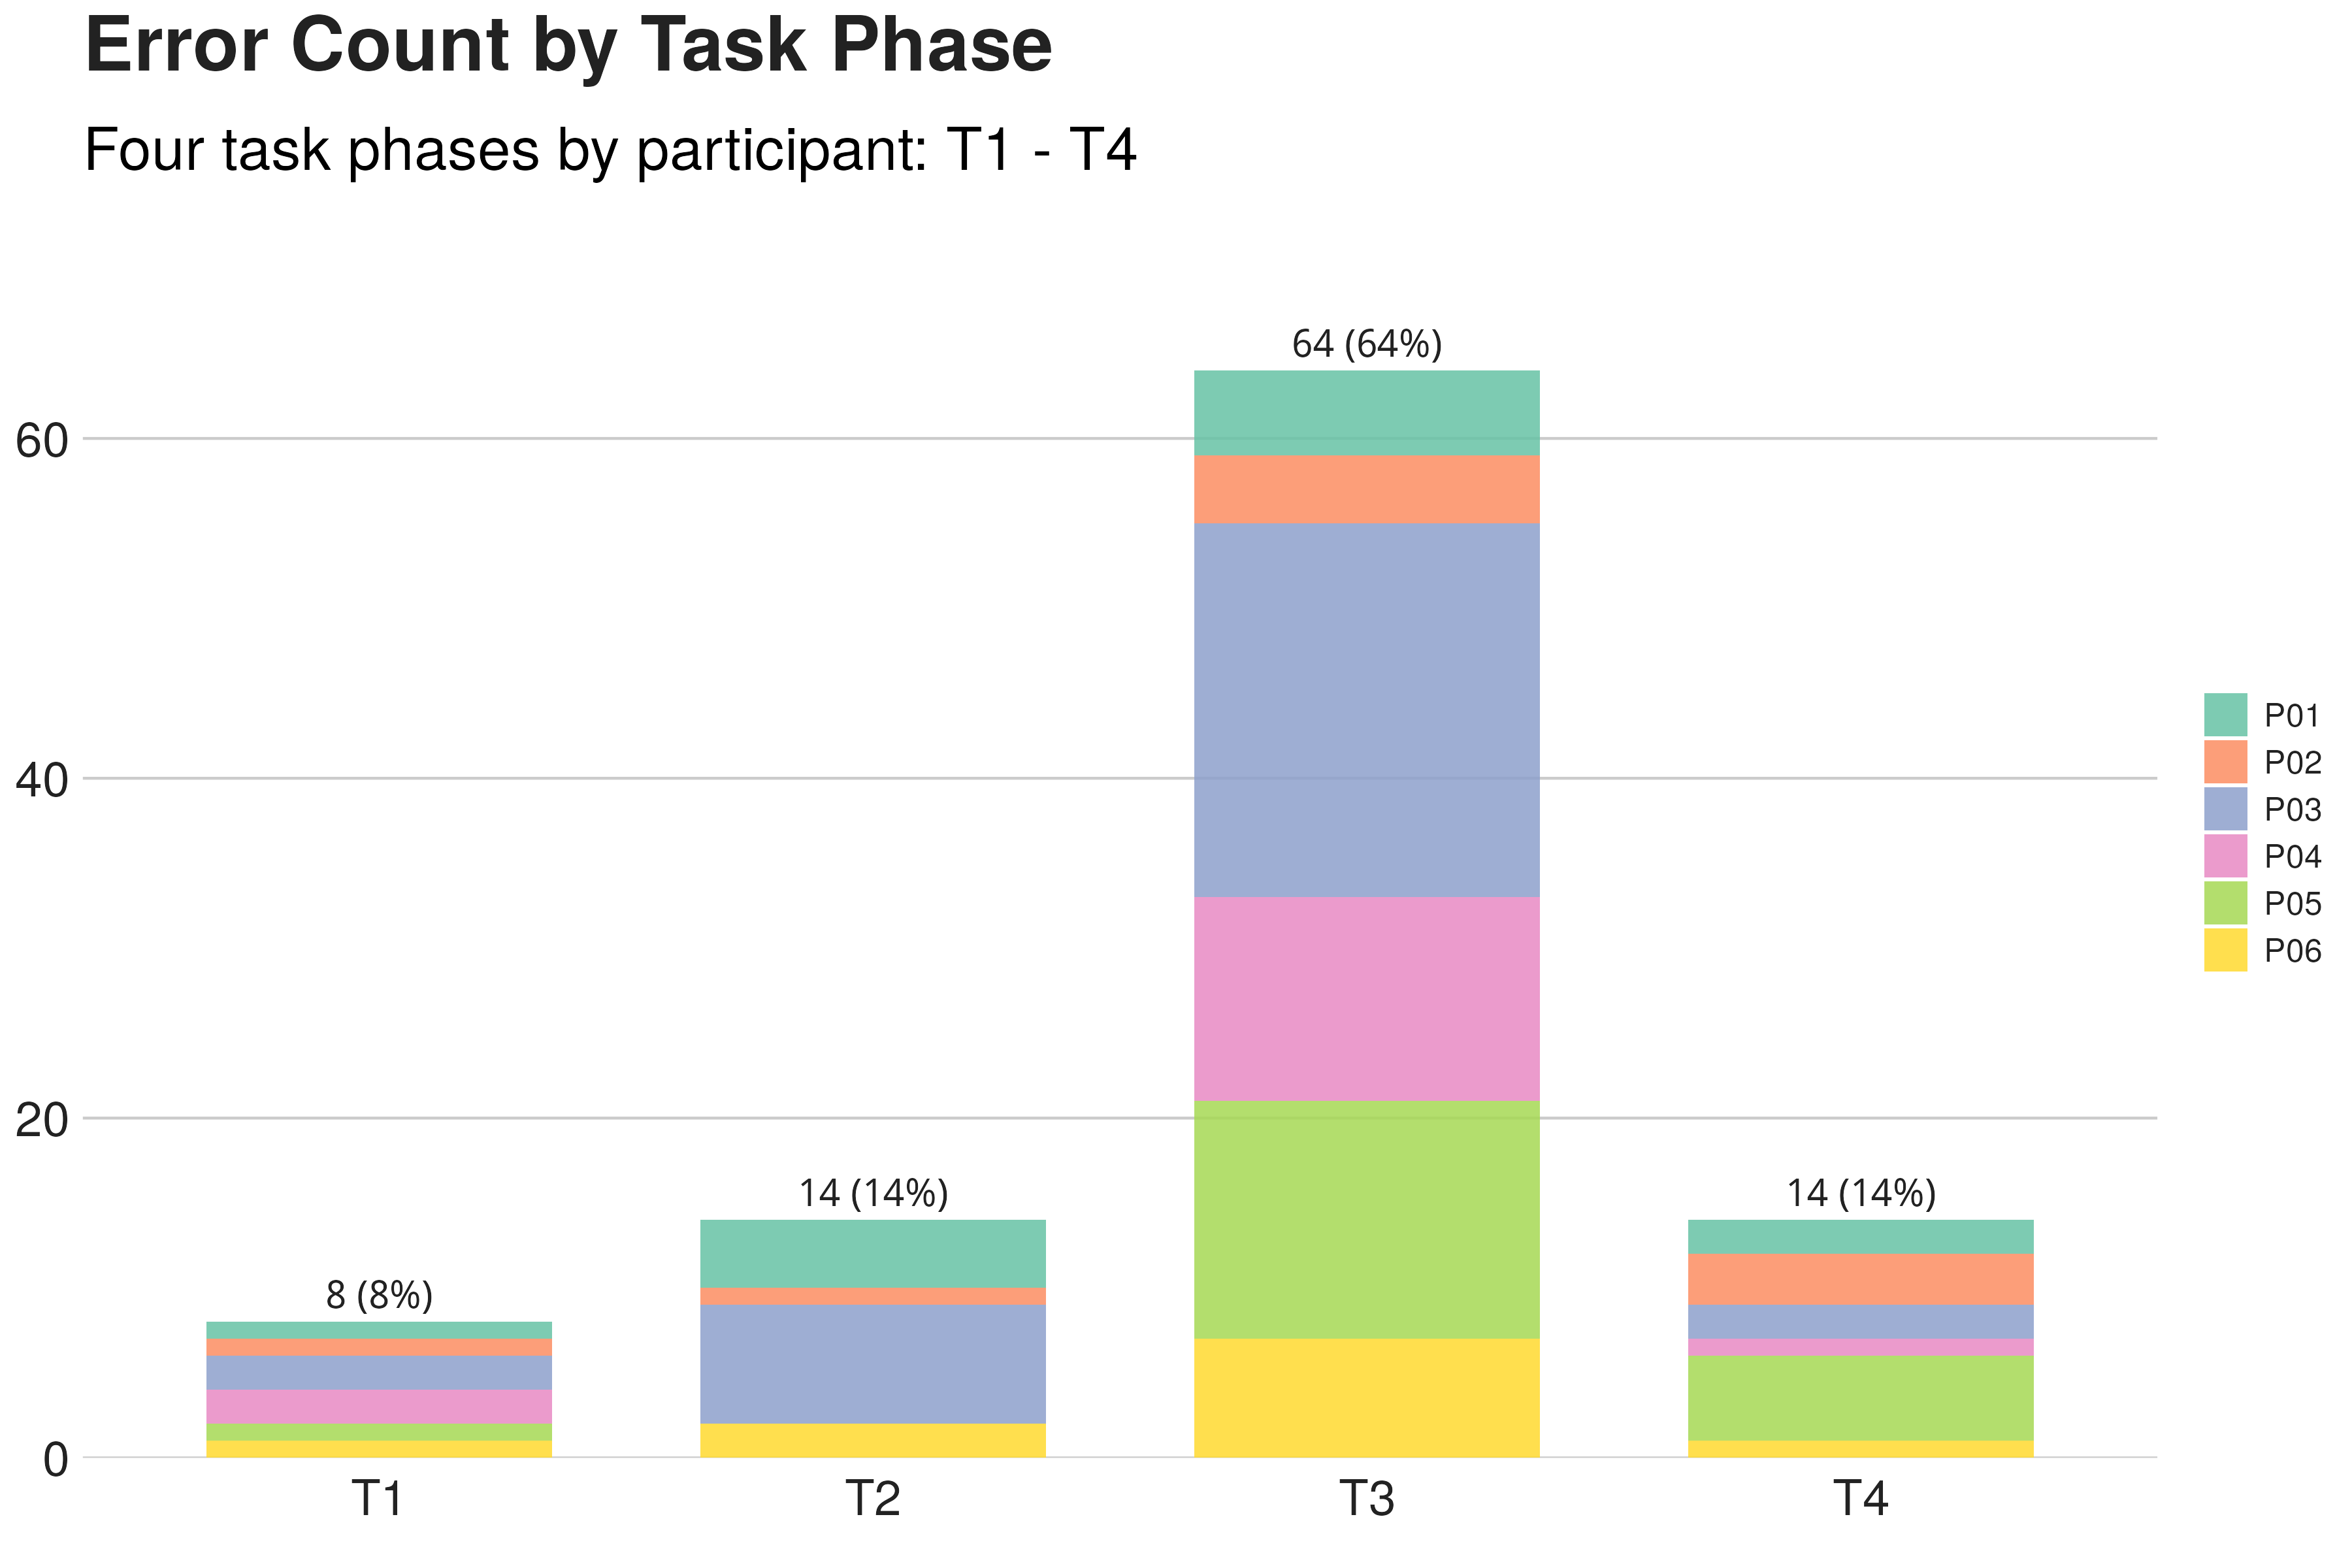
Moderated sessions with 6 STEM participants performing One-Way ANOVA tasks. 100 error events coded across 4 task phases.
n=6 STEMSUS 62.92NASA-TLX 19.83
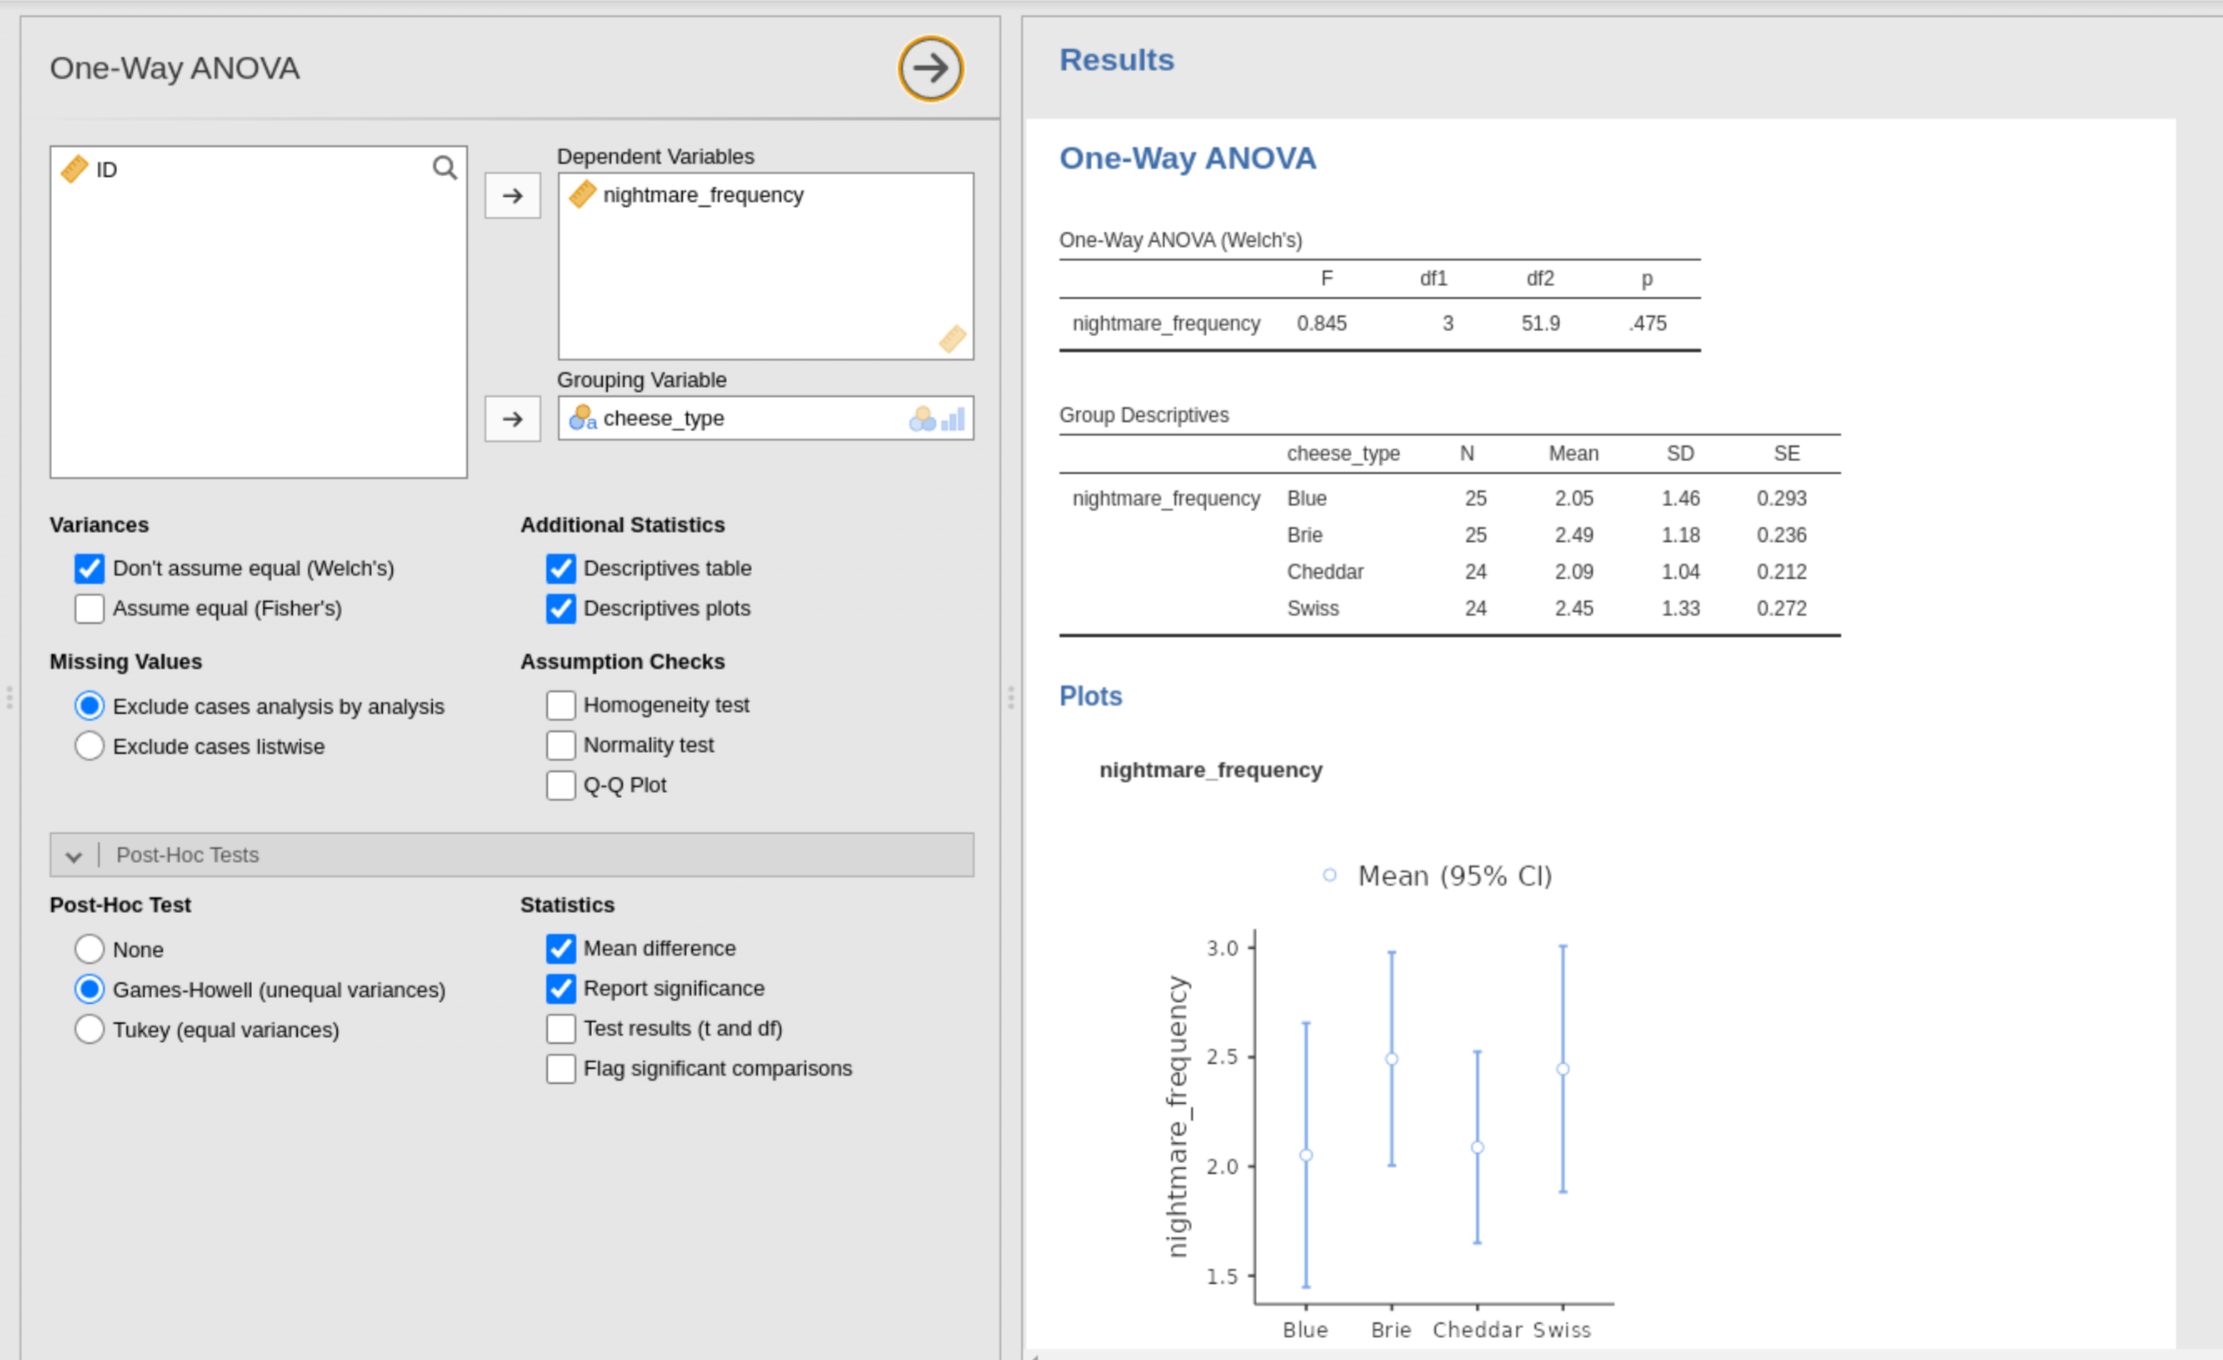
Jamovi is beloved for making statistics feel friendly. Across three studies, human think-aloud testing, expert PURE walkthroughs, and a 7-agent AI benchmark, I found that its calm surface silently lets users reach wrong conclusions.
 the pufferfish trilogy
TL;DR
Context
Jamovi is free, open-source statistics software positioned as the friendly answer to SPSS. Its pufferfish mascot, clean spreadsheets, and direct menus carry a mission: make statistics accessible to everyone, not just methodologists.
Approachability and statistical correctness make different promises. When a tool feels effortless, novices readily extend that trust to their output, assuming that a calm interface means a valid analysis.
The central research question: does Jamovi’s approachability come at the cost of diagnostic awareness? What happens when novices trust a silent interface to catch their methodological mistakes?
“It feels so intuitive to use, I thought I was doing everything right.”
Participant P03 · Think-aloud session (reported low subjective workload, yet generated misconfigured ANOVA output)
Role
Lead Researcher
Experimental design, moderation, qualitative coding
Scope
3-Phase Trilogy
Think-aloud protocols, PURE expert walkthrough, AI agent benchmark
Focus
Statistical UX
Investigating operational ease vs. cognitive diagnostic failure
Research questions
Examining whether an approachable surface conceals critical methodological errors during One-Way ANOVA tasks.
Explaining the paradox between low perceived effort (NASA-TLX 19.83) and marginal usability scores (SUS 62.92).
Evaluating Computer Use agent navigation and the impact of minimal contextual cues on machine comprehension.
Methods
phase one
Moderated sessions with 6 STEM participants performing One-Way ANOVA tasks. 100 error events coded across 4 task phases.
phase two
3 UX experts independently evaluated 14 workflow steps (42 ratings) using PURE methodology alongside 10 Nielsen heuristics.
phase three
7 AI agent models evaluated on autonomous task execution via Computer Use and screenshot statistical interpretation.
Key findings
100 error events across moderated sessions were coded across the four task phases. Over 64% clustered in the ANOVA execution stage alone.
Agent Experience (AX)
In Phase III, I evaluated 7 AI models using Computer Use to drive Jamovi through the same One-Way ANOVA tasks. Six of seven failed to complete autonomously, encountering the exact same affordance traps that tripped human participants: silent drag mismatches, subtle icon cues, and unverified default selections. Only GPT-5.4-xHigh completed the full pipeline.
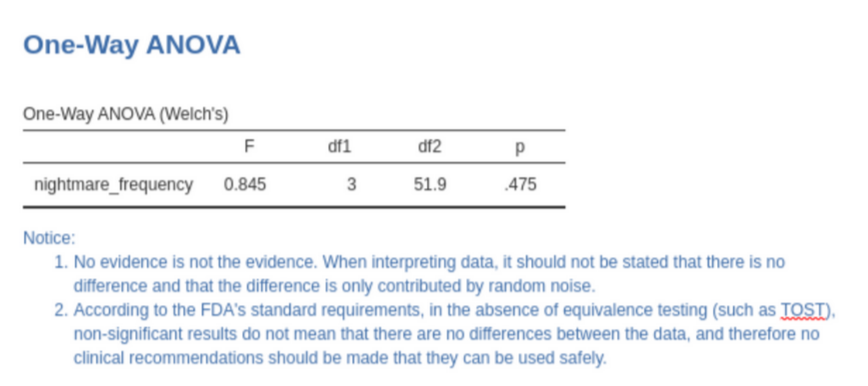
Next, I tested screenshot interpretation across models under default output versus with a two-line contextual hint (incorporating FDA equivalence testing standards). Accuracy surged from 28/50 to 42/50. Interface legibility and persistent context descriptions are low-cost interventions that benefit both humans and machines.
7 AI models evaluated via Computer Use · 1 completed autonomous analysis task
Default output
With two-line contextual hint
Screenshot interpretation accuracy across models: before vs. after textual guidance intervention
Replace silent icon flickers with explicit error banners when variable types or distributions mismatch.
Evidence: Finding 3 (Silent Drag)Introduce statistical linting to catch data entry errors before running hypothesis tests.
Evidence: Phase I (Data QA)Implement progressive disclosure wizards for ANOVA workflows, surfacing assumption validation contextually.
Evidence: Finding 1 (Task 3 Peak)Embed standardized statistical interpretation caveats directly in output panes to aid humans and AI agents.
Evidence: Phase III (AX Hint)critical moderate polish
SUS
NASA-TLX (of 100)
PURE (of 42)
error events
of 7 agents completed
Limitations & Reflection
Small samples bound every phase of this study: six users, three experts, seven agents. The patterns they reveal are consistent and mutually reinforcing, but individual metrics should be read in context rather than generalized as population statistics.
Error coding reliability was handled with an explicit codebook refined across multiple passes. Still, having independent multi-rater agreement validation remains a valuable methodological next step.
The agent benchmark is a snapshot of fast-moving model capability. The specific 1/7 completion number will evolve as models improve; the underlying finding will not: interfaces are sensory environments for machines too.
Finally, this research focused on diagnostic evaluation rather than a deployed production redesign. Every recommendation is evidence-backed and ranked by empirical findings; closing the loop with open-source Jamovi contributions or an intervention study is the natural continuation.
“The most dangerous usability problems are the ones that feel like nothing at all.”